How cold is Antarctica? Weather by month
Antarctic temperatures by month from station records: highs, lows, wind and sea ice on the Peninsula, South Georgia and the Falklands, plus the South Pole and the records.
The short answer
On the Antarctic Peninsula, where cruises go, summer days (December to February) typically range from about 29°F (-2°C) overnight to 41°F (5°C) in the afternoon, with monthly means of 32°F to 35°F (0°C to 2°C). The interior is far colder: the South Pole averages -18°F (-28°C) in January and -76°F (-60°C) in July, and Vostok holds Earth's record low, -128.6°F (-89.2°C).
Facts checked October 15, 2026 against 23 sources.
How cold Antarctica is depends almost entirely on where you stand. On the Antarctic Peninsula, where nearly every cruise goes, an average summer day at Esperanza station runs from about 29°F (-2°C) at night to 41°F (5°C) in the afternoon, and from December to February monthly means at four research stations sit between 32°F and 35°F (-0.1°C and 1.6°C).81234 At the South Pole, 9,300 feet (2,835 m) up on the ice sheet, the warmest month averages -17°F (-27.3°C) and July -76°F (-60.2°C).56 South Georgia and the Falkland Islands, often added to a cruise, are milder: about 43°F (6.1°C) and 51°F (10.7°C) in January.78
Every average on this page is our own calculation from station records, not a forecast: 1991 to 2020 monthly means from the British Antarctic Survey's READER tables, and average daily highs and lows from NOAA's daily summaries.18 A monthly mean averages day and night together, so afternoons run warmer and nights colder. Daylight, wildlife, crowds and fares by month are in the best time to visit Antarctica.
Antarctic Peninsula weather by month
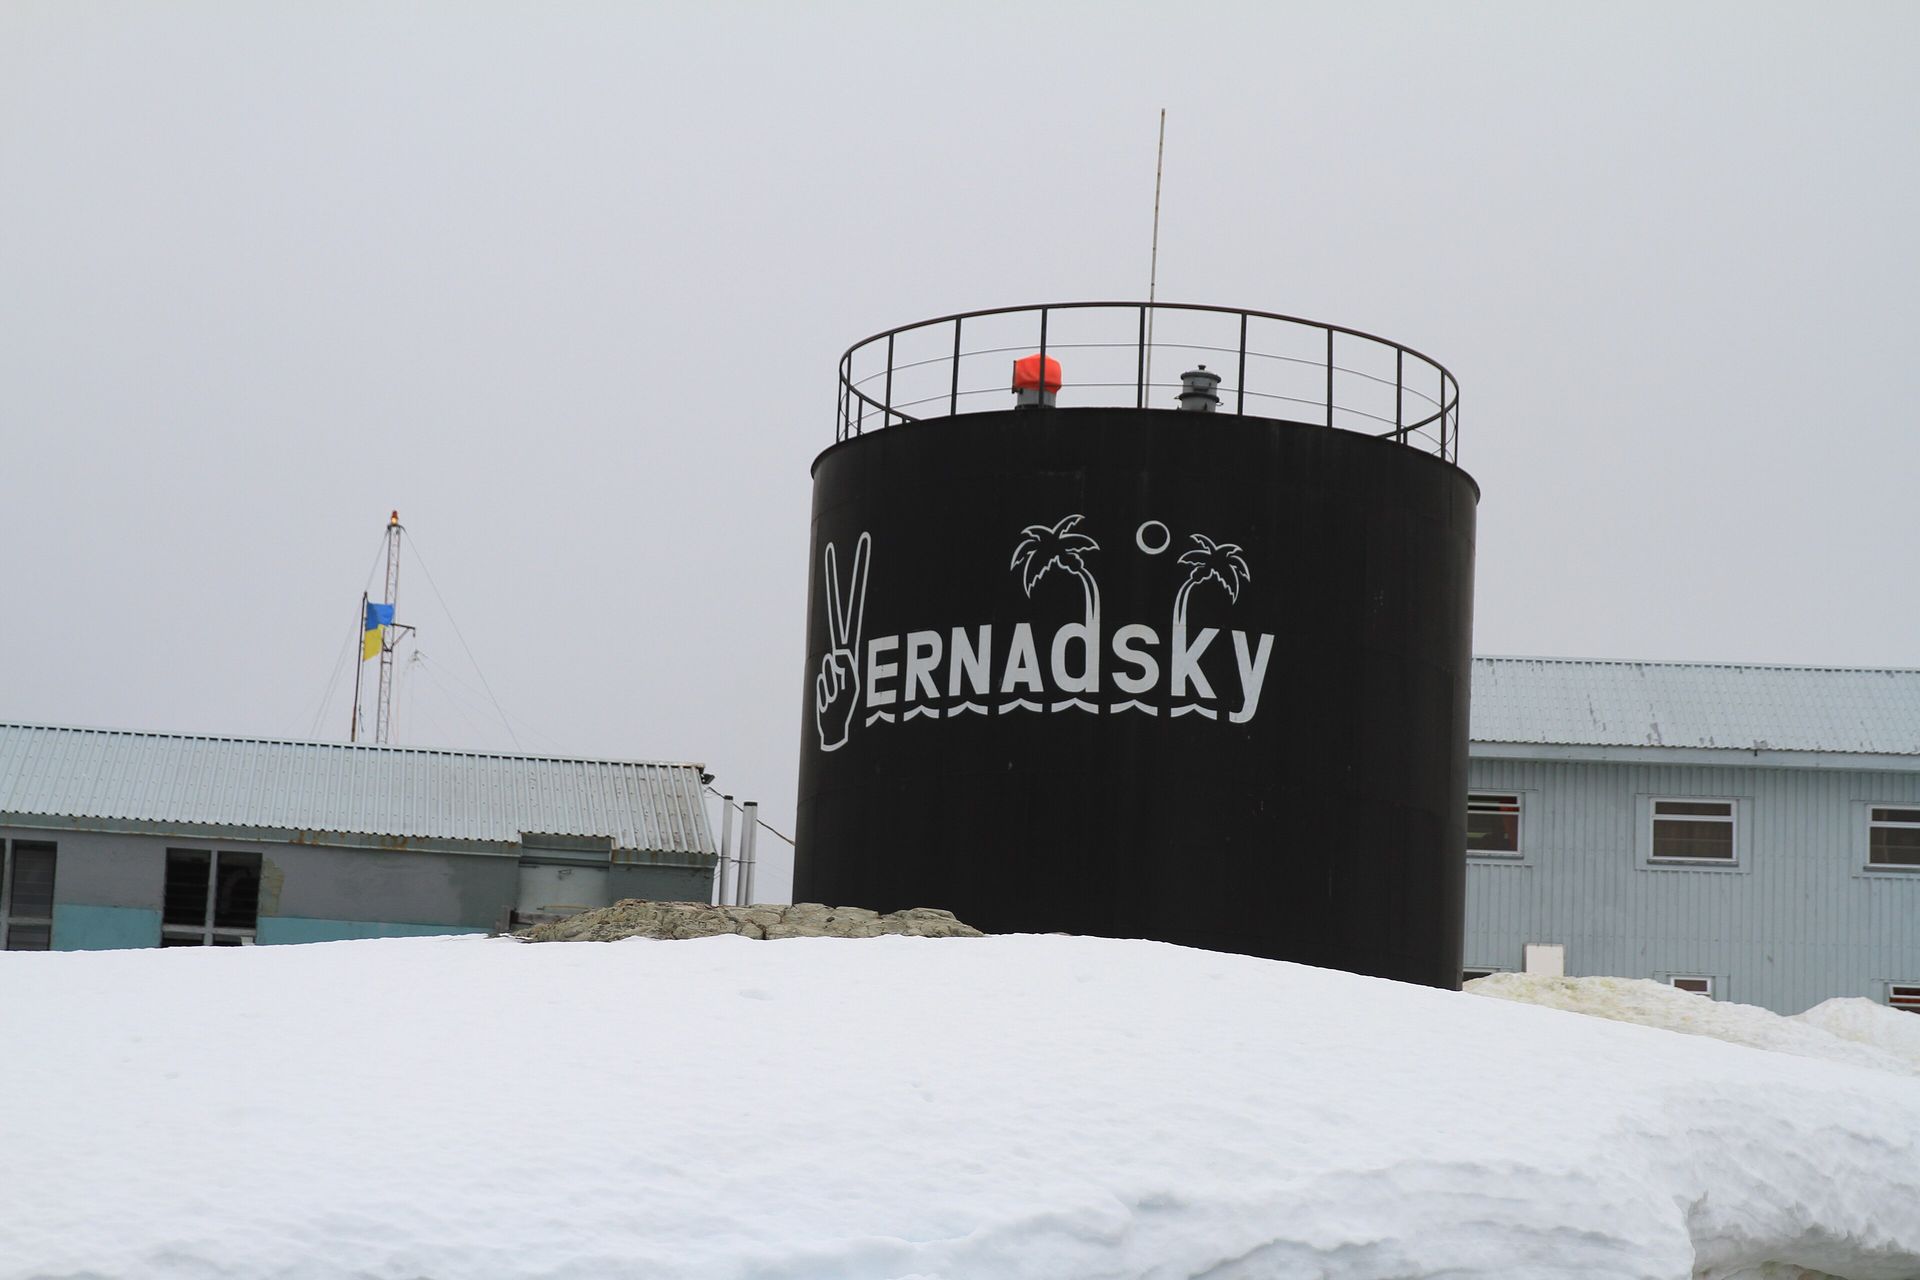
The Peninsula's cruise season sits right on the freezing line: monthly means run from 23°F (-5.0°C) at the coldest station in October to 35°F (1.6°C) at the warmest in January and February. The table covers four stations from north to south, Bellingshausen on King George Island (62°S), Esperanza (63°S), Faraday/Vernadsky (65°S) and Rothera (67.5°S), and gives Esperanza's average daily high and low, the swing you feel over a day ashore.
| Month | Mean air temperature, four stations1234 | Average high / low, Esperanza8 | Mean wind, four stations9 | Sea ice around Antarctica11 |
|---|---|---|---|---|
| October | 23°F to 27°F (-5.0°C to -2.6°C) | 33°F / 18°F (0.4°C / -7.9°C) | 12 to 18 mph (19 to 30 km/h) | 7.0 million sq mi (18.2 million km²) |
| November | 28°F to 30°F (-2.3°C to -1.0°C) | 37°F / 25°F (2.9°C / -3.7°C) | 10 to 16 mph (16 to 27 km/h) | 6.1 million sq mi (15.9 million km²) |
| December | 32°F to 33°F (-0.1°C to 0.8°C) | 40°F / 29°F (4.3°C / -1.7°C) | 8 to 15 mph (13 to 24 km/h) | 4.0 million sq mi (10.4 million km²) |
| January | 34°F to 35°F (1.1°C to 1.6°C) | 41°F / 30°F (4.8°C / -1.1°C) | 8 to 14 mph (12 to 23 km/h) | 1.9 million sq mi (5.0 million km²) |
| February | 33°F to 35°F (0.7°C to 1.6°C) | 40°F / 29°F (4.6°C / -1.9°C) | 9 to 15 mph (15 to 25 km/h) | 1.2 million sq mi (3.1 million km²) |
| March | 28°F to 33°F (-2.0°C to 0.5°C) | 36°F / 23°F (2.2°C / -5.2°C) | 10 to 16 mph (17 to 26 km/h) | 1.6 million sq mi (4.1 million km²) |
Three patterns stand out. January is the warmest month at every station, tied with February at Bellingshausen. The south is colder at the edges of the season but not in midsummer: in October, Rothera averages 4.3°F (2.4°C) less than Bellingshausen, while in January the four stations sit within 1°F (0.5°C) of each other.34 And the wind drops as summer comes: all four stations are calmest in January and, within the cruise season, windiest in October, though Faraday gets only about half Bellingshausen's January wind.9
The sea ice column is the whole ring around the continent, 1991 to 2020 means from satellite records.11 In October it is still close to its September peak, which is why the season's first voyages meet the most ice; by January nearly three quarters of it has gone.
How cold is Antarctica in summer?
On the Peninsula, summer hovers around freezing: from December to February, Esperanza's average daily low is 29°F to 30°F (-1.9°C to -1.1°C) and its average high 40°F to 41°F (4.3°C to 4.8°C).8 The interior never thaws. The South Pole's warmest months, December and January, average -17°F (-27.3°C) and -18°F (-28.1°C),5 and the highest temperature ever recorded on the plateau above 8,200 feet (2,500 m) is 19.4°F (-7.0°C).12
Wind makes the Peninsula feel colder than the thermometer says. Take Esperanza's average January low of 30°F (-1.1°C) with its average January wind of about 12 mph (20 km/h): by the National Weather Service's wind chill formula, that feels like 20°F (-6.6°C) on bare skin.8913 The weather service adds that bright sunshine can make it feel 10°F to 18°F warmer, and that frostbite needs the actual air, not just the wind chill, to be below freezing.13
The Drake Passage crossing is milder but windier. In our analysis of 16 years of model data, air over the route averaged 37°F (2.8°C) in November and 40°F (4.5°C) in January, with mean winds of 17 to 19 knots (20 to 22 mph) from November to March.14 How to dress for both is in what to pack for Antarctica.
Antarctic temperatures by month, all year
Monthly means run from 34°F (1.1°C) in January to 20°F (-6.9°C) in August on the Peninsula coast, and from -18°F (-28.1°C) to -76°F (-60.2°C) at the South Pole.15 Winter, April to September, is when the interior shows its range. No tourist ship lands then, but these are the numbers most people mean when they ask how cold Antarctica gets.
| Month | Peninsula: Faraday/Vernadsky1 | South Georgia: King Edward Point7 | Falklands: Mount Pleasant8 | South Pole5 | Vostok16 |
|---|---|---|---|---|---|
| January | 34°F (1.1°C) | 43°F (6.1°C) | 51°F (10.7°C) | -18°F (-28.1°C) | -25°F (-31.9°C) |
| February | 34°F (1.0°C) | 44°F (6.5°C) | 50°F (10.2°C) | -41°F (-40.7°C) | -47°F (-44.0°C) |
| March | 32°F (-0.1°C) | 42°F (5.5°C) | 49°F (9.2°C) | -65°F (-53.7°C) | -73°F (-58.1°C) |
| April | 29°F (-1.6°C) | 37°F (2.9°C) | 44°F (6.8°C) | -71°F (-57.5°C) | -85°F (-64.8°C) |
| May | 27°F (-3.0°C) | 33°F (0.7°C) | 40°F (4.7°C) | -72°F (-57.7°C) | -87°F (-65.9°C) |
| June | 23°F (-4.8°C) | 31°F (-0.6°C) | 37°F (2.8°C) | -73°F (-58.1°C) | -87°F (-65.9°C) |
| July | 21°F (-6.4°C) | 30°F (-1.3°C) | 36°F (2.3°C) | -76°F (-60.2°C) | -87°F (-65.9°C) |
| August | 20°F (-6.9°C) | 31°F (-0.7°C) | 37°F (3.0°C) | -75°F (-59.6°C) | -88°F (-66.9°C) |
| September | 21°F (-6.2°C) | 34°F (0.9°C) | 39°F (4.1°C) | -74°F (-58.9°C) | -86°F (-65.7°C) |
| October | 25°F (-4.0°C) | 37°F (3.0°C) | 43°F (6.2°C) | -60°F (-50.9°C) | -70°F (-56.4°C) |
| November | 29°F (-1.7°C) | 40°F (4.5°C) | 47°F (8.1°C) | -35°F (-37.2°C) | -43°F (-41.4°C) |
| December | 32°F (-0.1°C) | 42°F (5.5°C) | 49°F (9.5°C) | -17°F (-27.3°C) | -24°F (-31.4°C) |
The coast cools only gently, about 14°F (8°C) from January to August at Faraday, while the Pole drops 58°F (32°C) by July.15 Once the interior is dark it barely changes: from April to September the Pole's monthly means all sit between -71°F and -76°F (-57.5°C and -60.2°C).5 Vostok, Russia's station 11,220 feet (3,420 m) up on the East Antarctic Plateau, is colder still in every month.161218
South Georgia and Falklands weather by month
Both stay above freezing on average all season. South Georgia, farther south, runs about 8°F (4.5°C) cooler than the Falklands in January, and the Falklands are the mildest and, in every month from October to March, the windiest of the stations on this page.
| Month | South Georgia mean7 | South Georgia high / low8 | Falklands mean8 | Falklands high / low8 |
|---|---|---|---|---|
| October | 37°F (3.0°C) | 45°F / 31°F (7.5°C / -0.3°C) | 43°F (6.2°C) | 52°F / 36°F (11.1°C / 2.5°C) |
| November | 40°F (4.5°C) | 49°F / 34°F (9.2°C / 1.0°C) | 47°F (8.1°C) | 56°F / 39°F (13.5°C / 3.9°C) |
| December | 42°F (5.5°C) | 50°F / 36°F (10.2°C / 2.3°C) | 49°F (9.5°C) | 59°F / 42°F (14.7°C / 5.3°C) |
| January | 43°F (6.1°C) | 52°F / 37°F (11.1°C / 2.9°C) | 51°F (10.7°C) | 61°F / 44°F (16.3°C / 6.6°C) |
| February | 44°F (6.5°C) | 52°F / 37°F (11.1°C / 2.8°C) | 50°F (10.2°C) | 60°F / 43°F (15.5°C / 6.3°C) |
| March | 42°F (5.5°C) | 49°F / 36°F (9.7°C / 2.2°C) | 49°F (9.2°C) | 57°F / 42°F (14.0°C / 5.5°C) |
South Georgia figures are for King Edward Point, the government station beside Grytviken. Its record has a long gap, so its means cover 2001 to 2025, and its highs and lows come from NOAA's daily data for the same years, which has gaps of its own.78 Its warmest month is February, and its mean wind sits near 11 mph (18 km/h) all season.79 The territory's government tells visitors that January temperatures at Grytviken have ranged from 32°F to 66°F (0°C to 19°C).15 Falklands figures are for Mount Pleasant, the islands' airport, 27 miles (43 km) from Stanley by our measure, where the mean wind is 17 to 19 mph (28 to 30 km/h) from October to March.8 Neither place gets a midnight sun: the longest day is about 17 hours at Grytviken.10
What is the average temperature in Antarctica?
There is no single number: Australia's Antarctic program puts the annual average at about 14°F (-10°C) on the coast and -76°F (-60°C) on the highest parts of the interior.17 By our calculation, the 1991 to 2020 annual mean is 27°F (-2.7°C) at Faraday/Vernadsky and -56°F (-49.2°C) at the South Pole.15 Height is a big reason the interior is so cold: the continent's average elevation is more than 6,500 feet (2,000 m), and an ice sheet covers 98% of the land.6
What is the coldest temperature ever recorded in Antarctica?
-128.6°F (-89.2°C), at Vostok on July 21, 1983, the lowest temperature ever measured at Earth's surface by a weather station, according to the World Meteorological Organization.12 Satellites have found colder snow. A 2018 study from the National Snow and Ice Data Center found nearly 100 spots high on the East Antarctic Plateau where the snow surface reached about -144°F (-98°C), mostly in July and August, and estimated the air above the coldest of them at about -137°F (-94°C).18 Those are satellite estimates, not station records.
What is the warmest temperature ever recorded in Antarctica?
64.9°F (18.3°C), at Esperanza on February 6, 2020, the WMO's record for the Antarctic mainland and adjoining islands.12 The WMO credits a large high-pressure system that drove warm downslope winds, and in the same review it rejected a 69.4°F (20.75°C) reading from Seymour Island, because an improvised radiation shield had biased the sensor.19 For all land and sea south of 60°S, the record is 67.6°F (19.8°C) at Signy Island on January 30, 1982.12
What is the temperature at the South Pole?
It ranges from a January mean of -18°F (-28.1°C) to a July mean of -76°F (-60.2°C), and the yearly mean is -56°F (-49.2°C).5 The U.S. Antarctic Program, which runs the station, gives similar round figures and an average wind of 10.8 knots.6 The sun sets once a year: in 2027 it goes down on March 22 and comes back up on September 21.10 Very few travelers feel it. White Desert, whose trips include a journey to the Pole, says it is visited by fewer than 500 people a year.21
How cold is Antarctica right now?
It depends on the month, so use the tables above for the normal and NOAA's South Pole meteorology page, which posts the observatory's latest temperature and wind, for a live reading.20 When we checked, at 20:49 UTC on October 15, 2026, the Pole read -44.2°F (-42.35°C) with a 5 mph (2.4 m/s) wind, warmer than its October mean of -60°F (-50.9°C).205
Does it snow in Antarctica?
Yes, but most of the continent gets very little. Australia's Antarctic program estimates the snowfall over the whole continent at about 6 inches (150 mm) of water a year, under 2 inches (50 mm) on the high plateau, generally more than 8 inches (200 mm) near the coast, and more than 39 inches (1,000 mm) in an area near the Bellingshausen Sea.17 Rain falls near the coast, and the Peninsula is cloudier than the interior.17 The South Pole holds the Antarctic record for the least precipitation, about 0.08 inches (2 mm) a year, while parts of the coast and the Peninsula average more than 31.5 inches (800 mm).12 So a Peninsula landing can come with snow or rain, even though the U.S. Antarctic Program calls the continent as a whole the driest place on earth.6
How windy is Antarctica?
Very, in places, and much less on a summer Peninsula beach. Australia's program calls Antarctica the windiest continent: cold air pours off the ice sheet as katabatic winds, and with a coastal storm these can top 62 mph (100 km/h) for days, with gusts measured well over 124 mph (200 km/h).17 It counts a blizzard as gale-force wind for at least an hour, below freezing, with visibility of 330 feet (100 m) or less.17 By contrast, the summer means at the four Peninsula stations run 8 to 15 mph (12 to 25 km/h) from December to February.9
How much sea ice is there around Antarctica?
It grows and shrinks about sixfold each year. Over 1991 to 2020 the extent averaged 7.2 million square miles (18.6 million km²) in September, its peak, and 1.2 million square miles (3.1 million km²) in February, its low.11 NSIDC notes that Antarctic sea ice is often much thinner than Arctic ice and nearly melts out each summer.22 Recent seasons have run low: every month of the 2025-26 cruise season, October to March, was 6% to 13% below the 1991 to 2020 average.11 Ice matters most on trips into the Weddell Sea for the emperor penguins of Snow Hill Island: Oceanwide puts the chance that the route there is free of multi-year pack ice at less than 50%.23
Which month has the best weather in Antarctica?
January, for most visitors: it is the warmest month at the Peninsula stations (February ties it at Bellingshausen) and the calmest at all four.12349
- Warmest: January, with February a close second.1234
- Calmest: December and January, the least windy months at the stations and on the Drake.914
- Longest days: around December 21, when the sun does not set at Rothera, just south of the Antarctic Circle.10
- Coldest of the season: October, with the most sea ice; late March cools again.111
- Mildest add-on: the Falklands, at 51°F (10.7°C) in January, though windier than any other station here.8
How long to go is in how many days you need in Antarctica, and which month suits your trip in the best time to visit Antarctica.
Places in this guide
Antarctic Peninsula
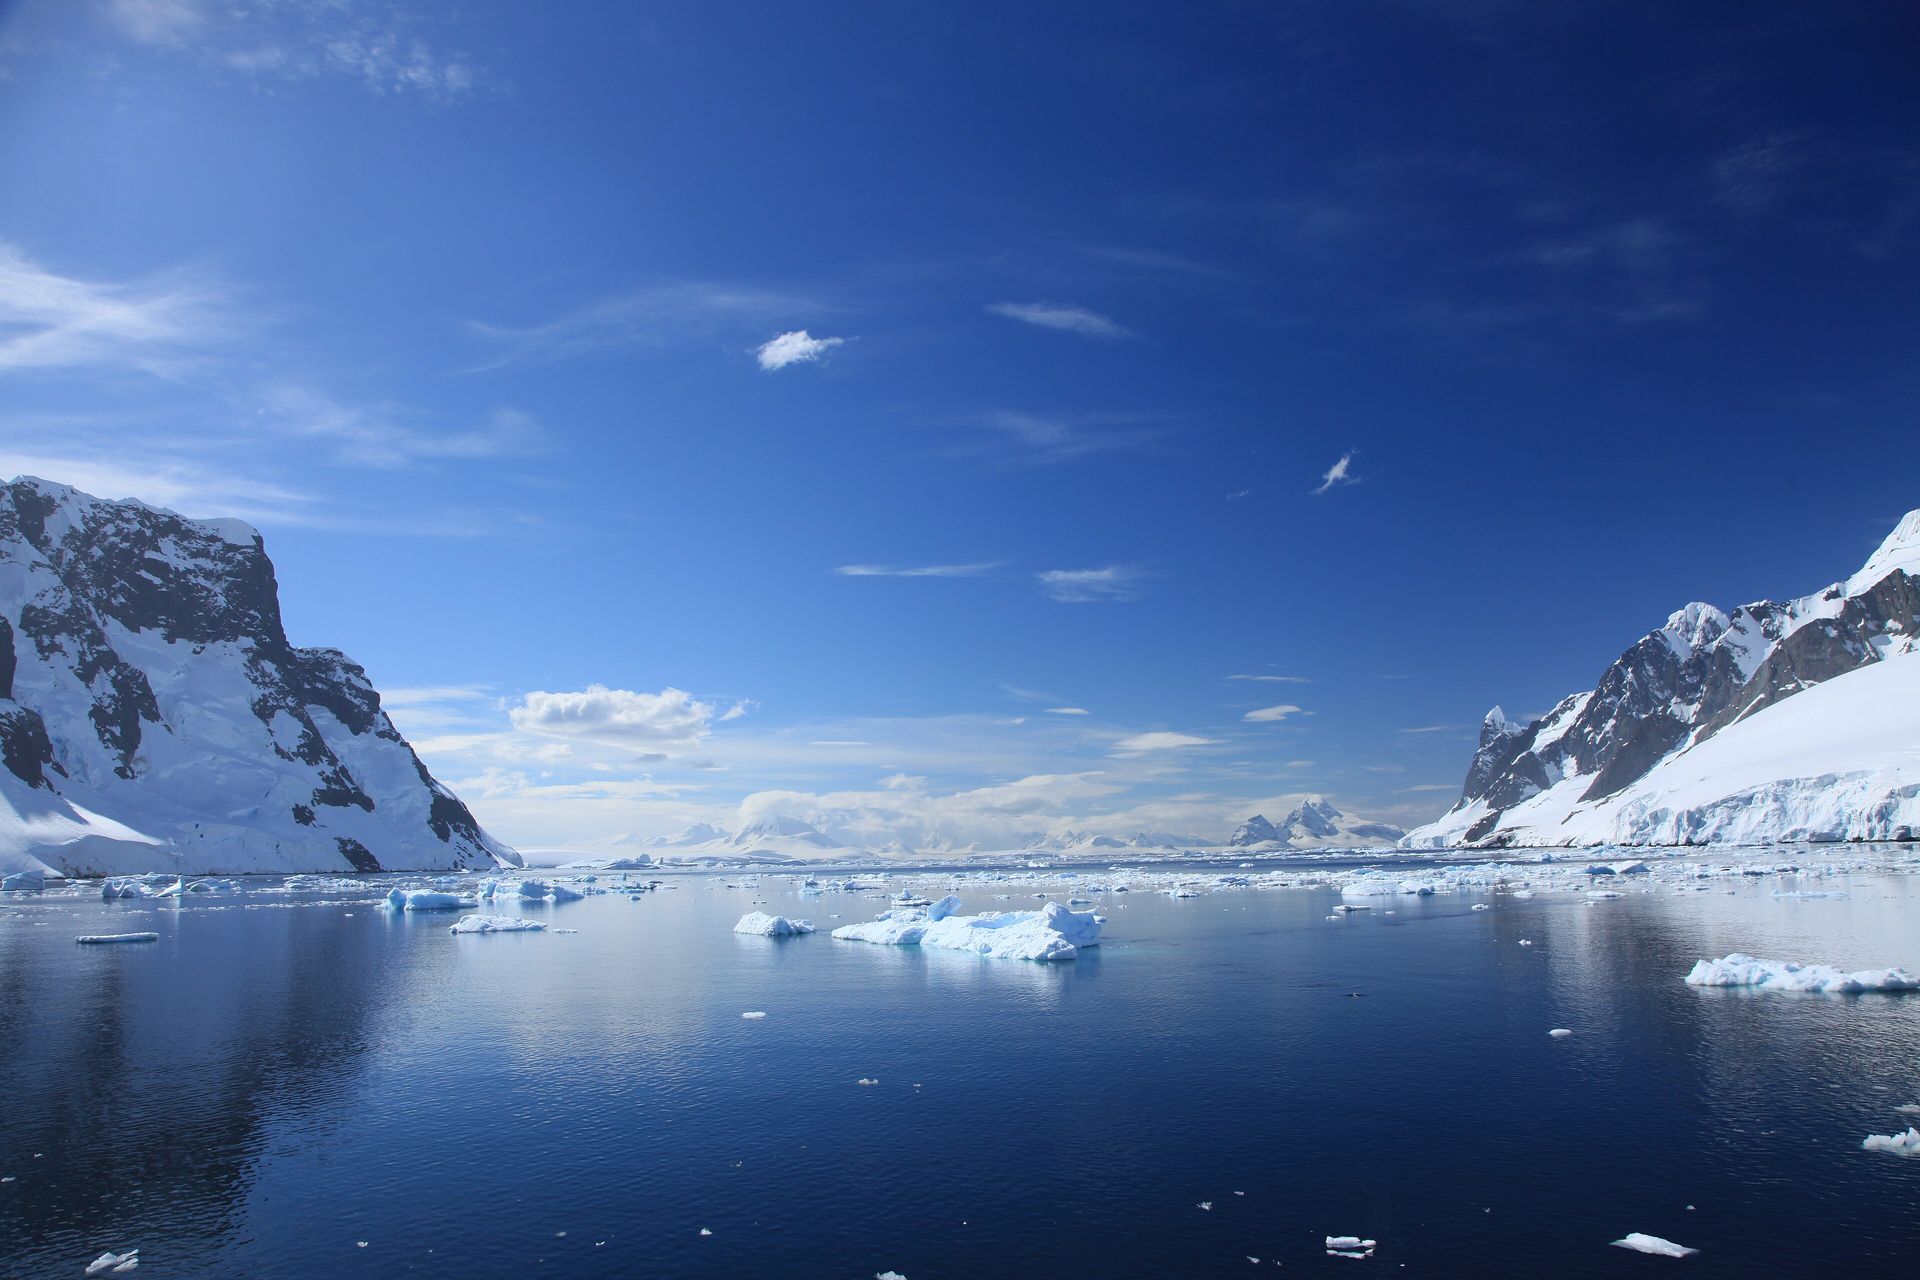
Planning an Antarctic Peninsula cruise: how long trips last, where ships land, the best month by temperature and wildlife, landing rules, ship sizes and starting fares.
South Georgia
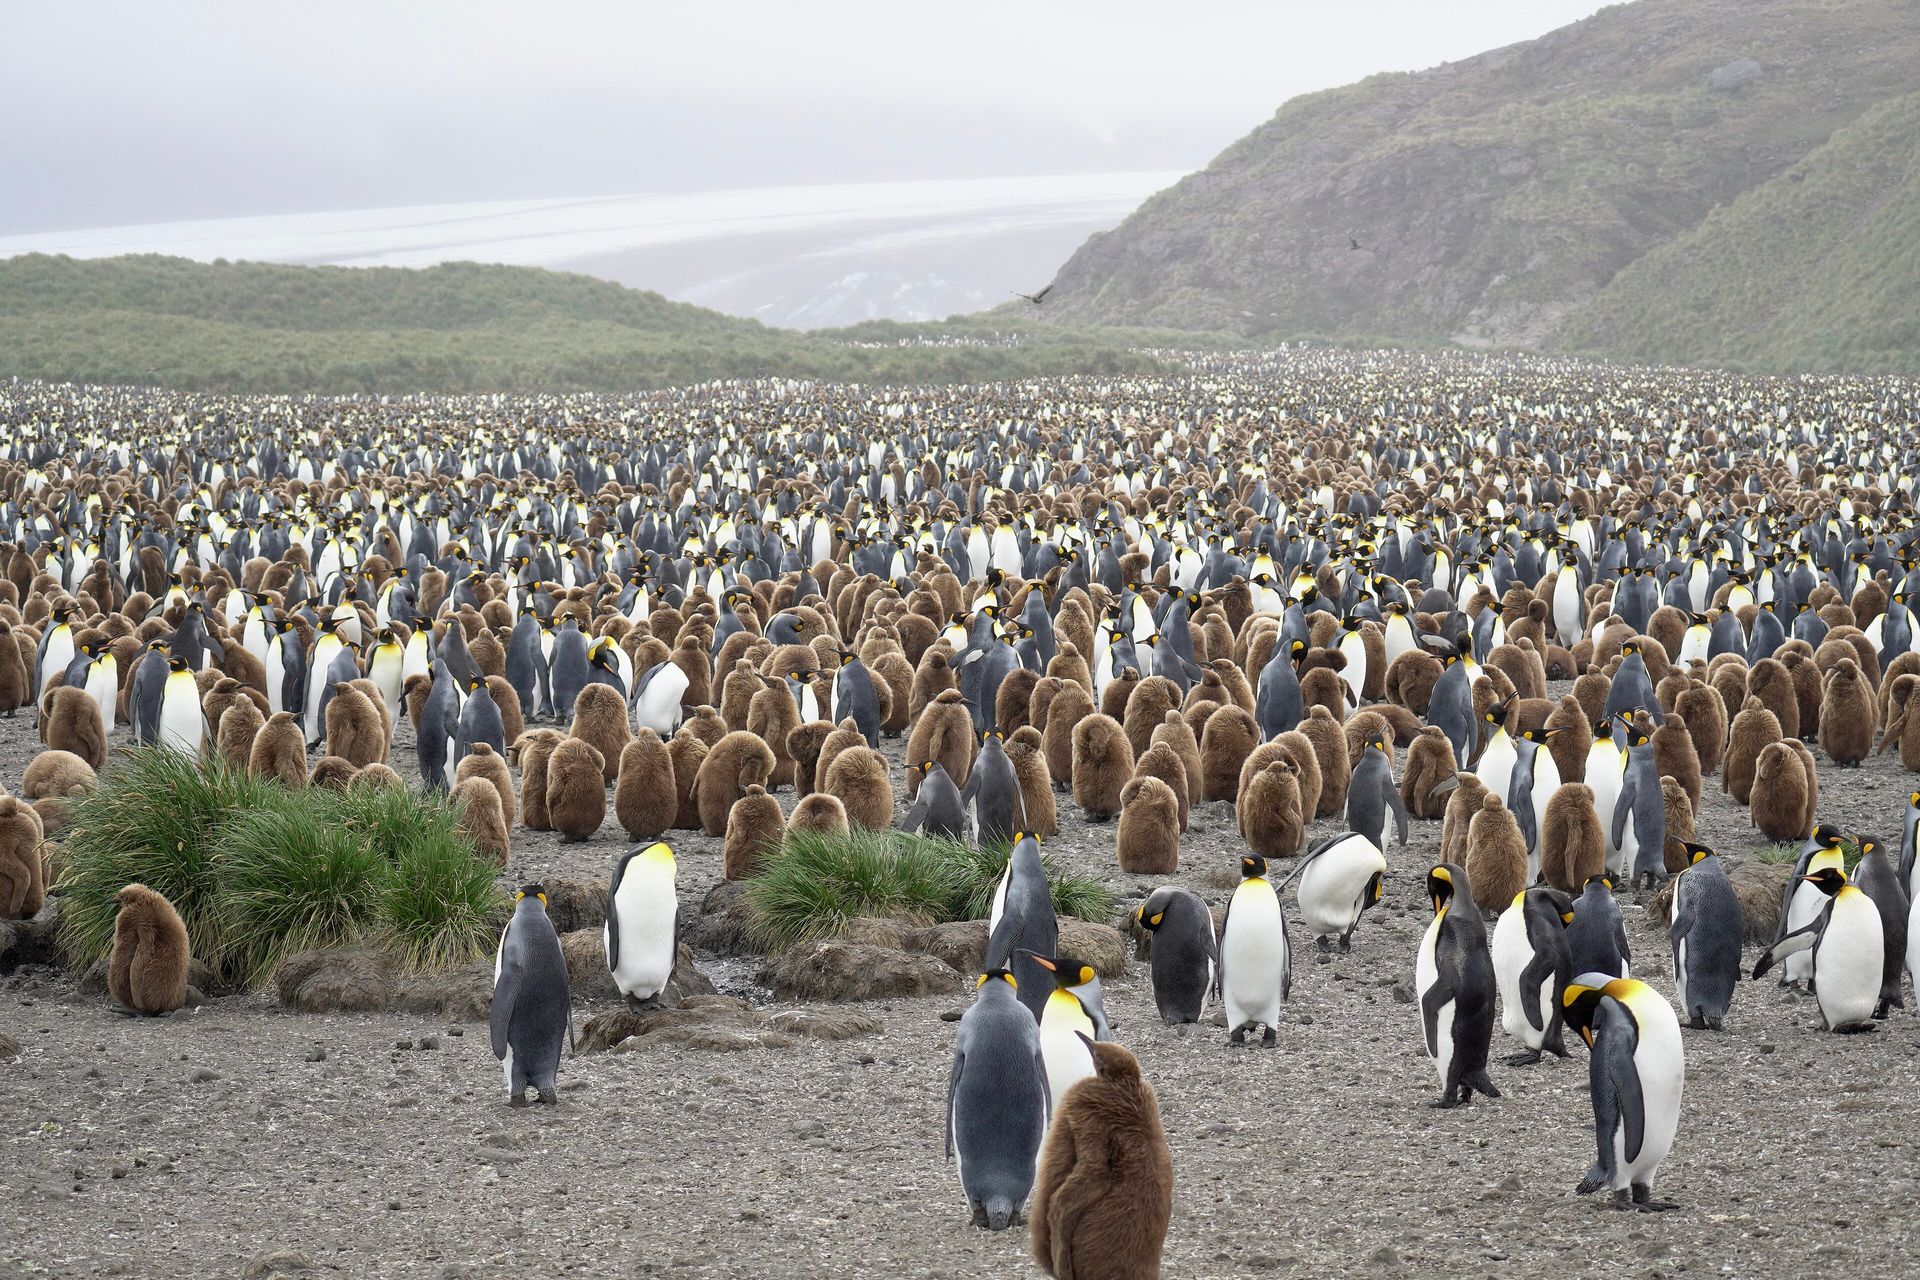
Where South Georgia is and how to visit it: which voyages go and what they cost, whether the extra week is worth it, the best months, the wildlife and the government's rules.
Falkland Islands
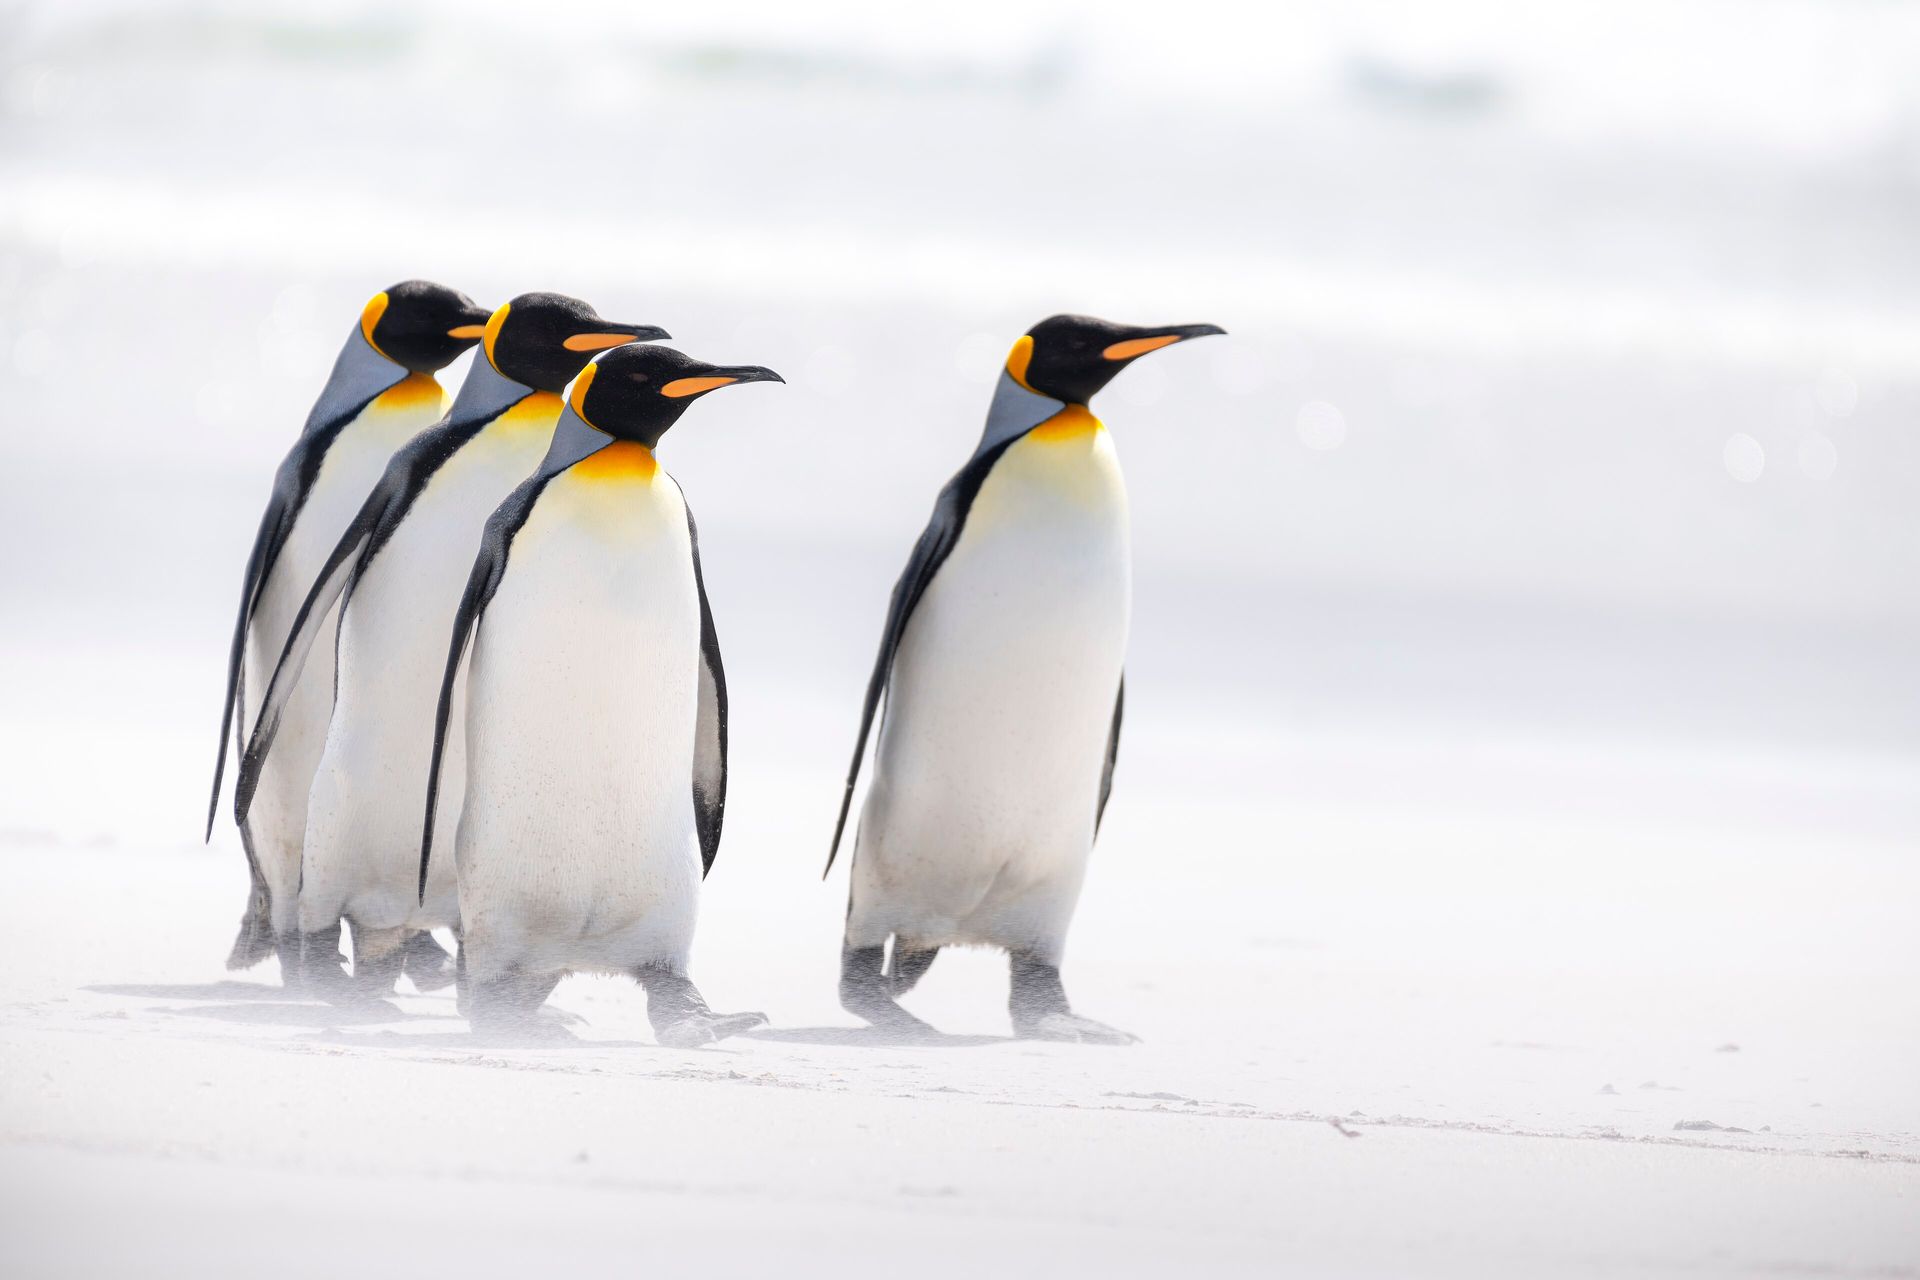
How to visit the Falkland Islands and what it costs: the weekly flight from Chile, the UK airbridge, the cruises that stop and their fares, the best penguin sites and months, and the rules.
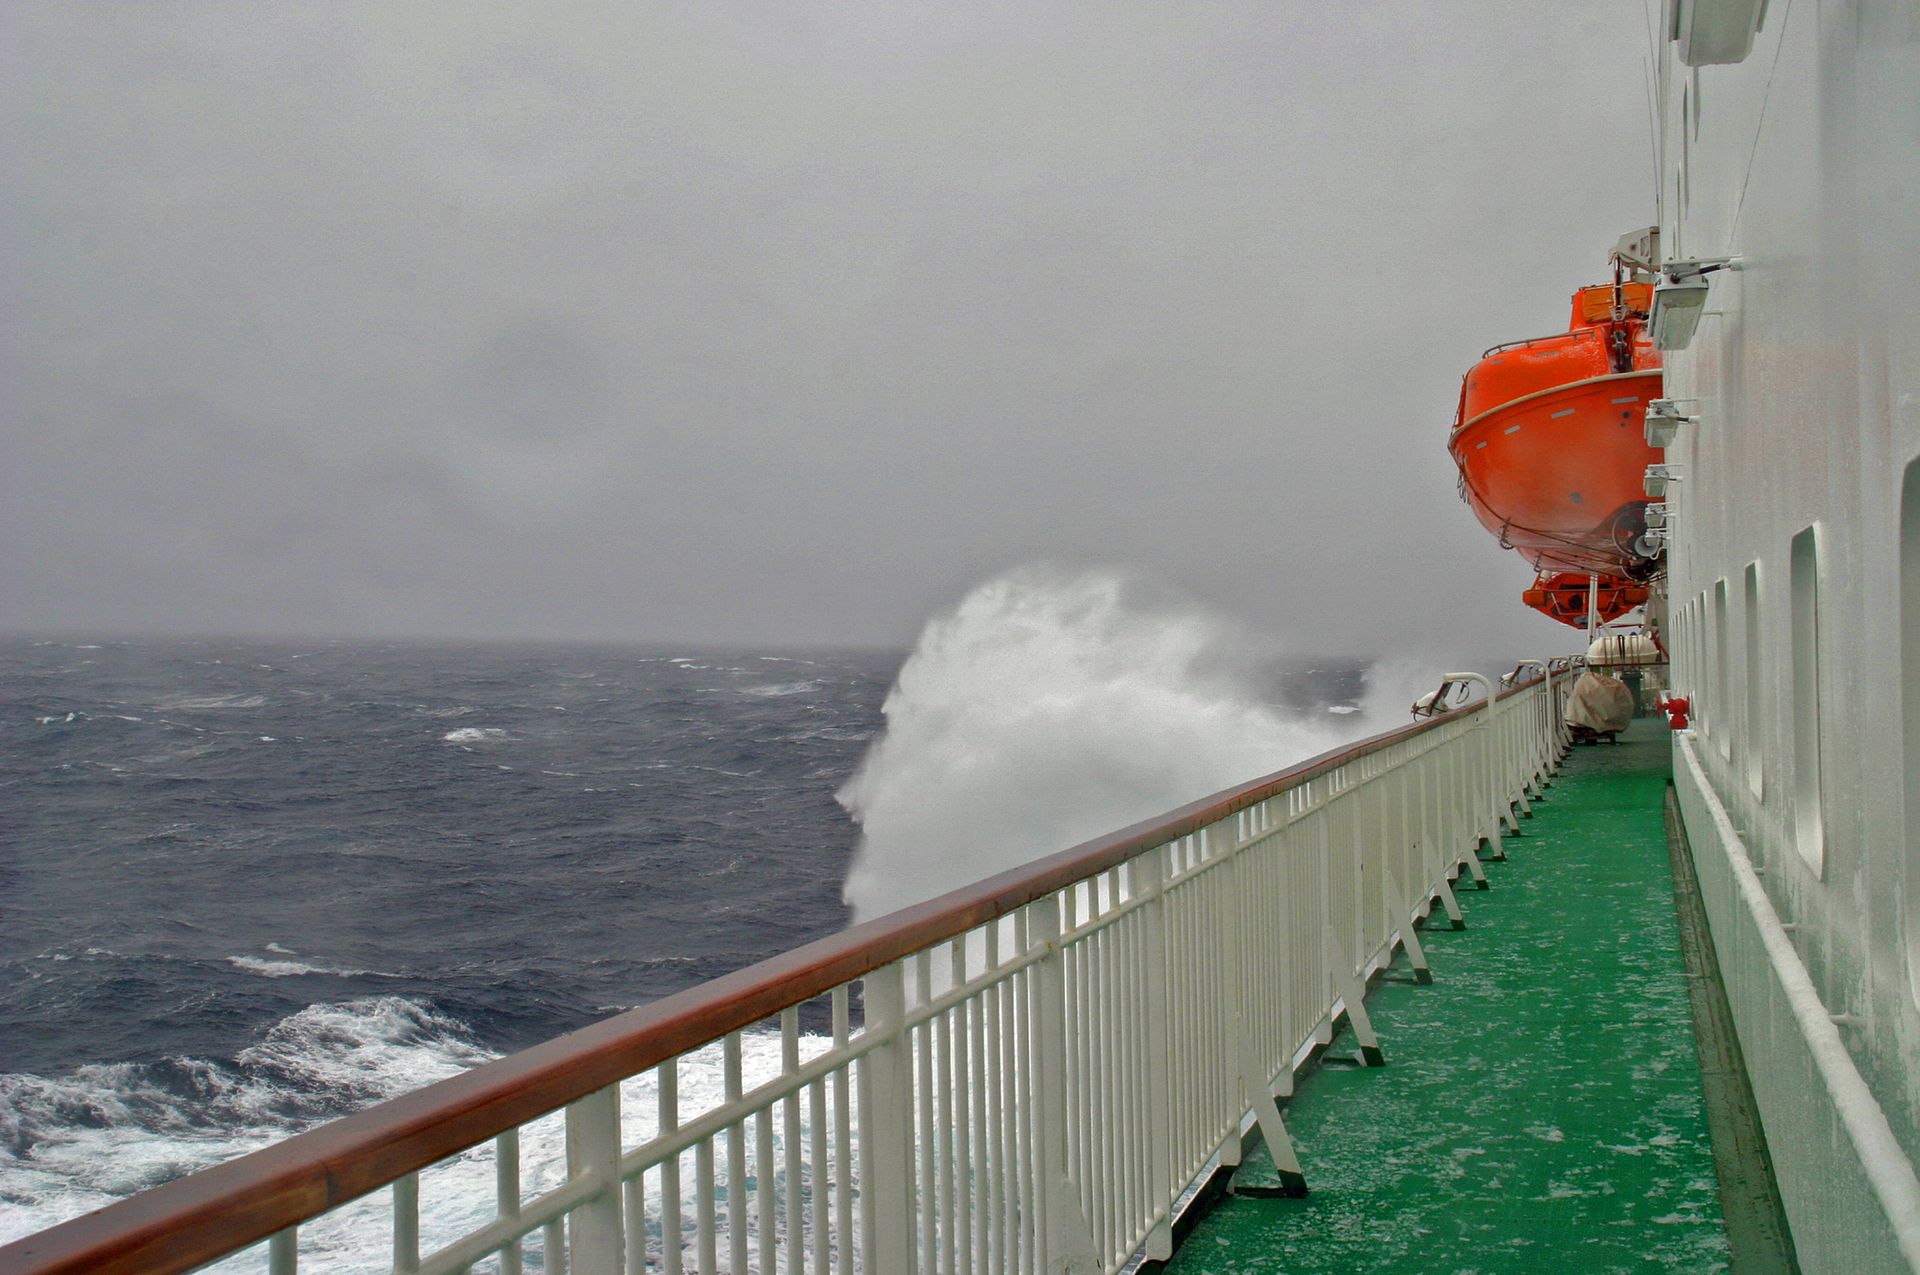
Drake Passage
How rough the Drake Passage really is, month by month, from 16 years of wave data, plus its weather, crossing times, seasickness remedies, flying over it and whether ships sink.
More guides
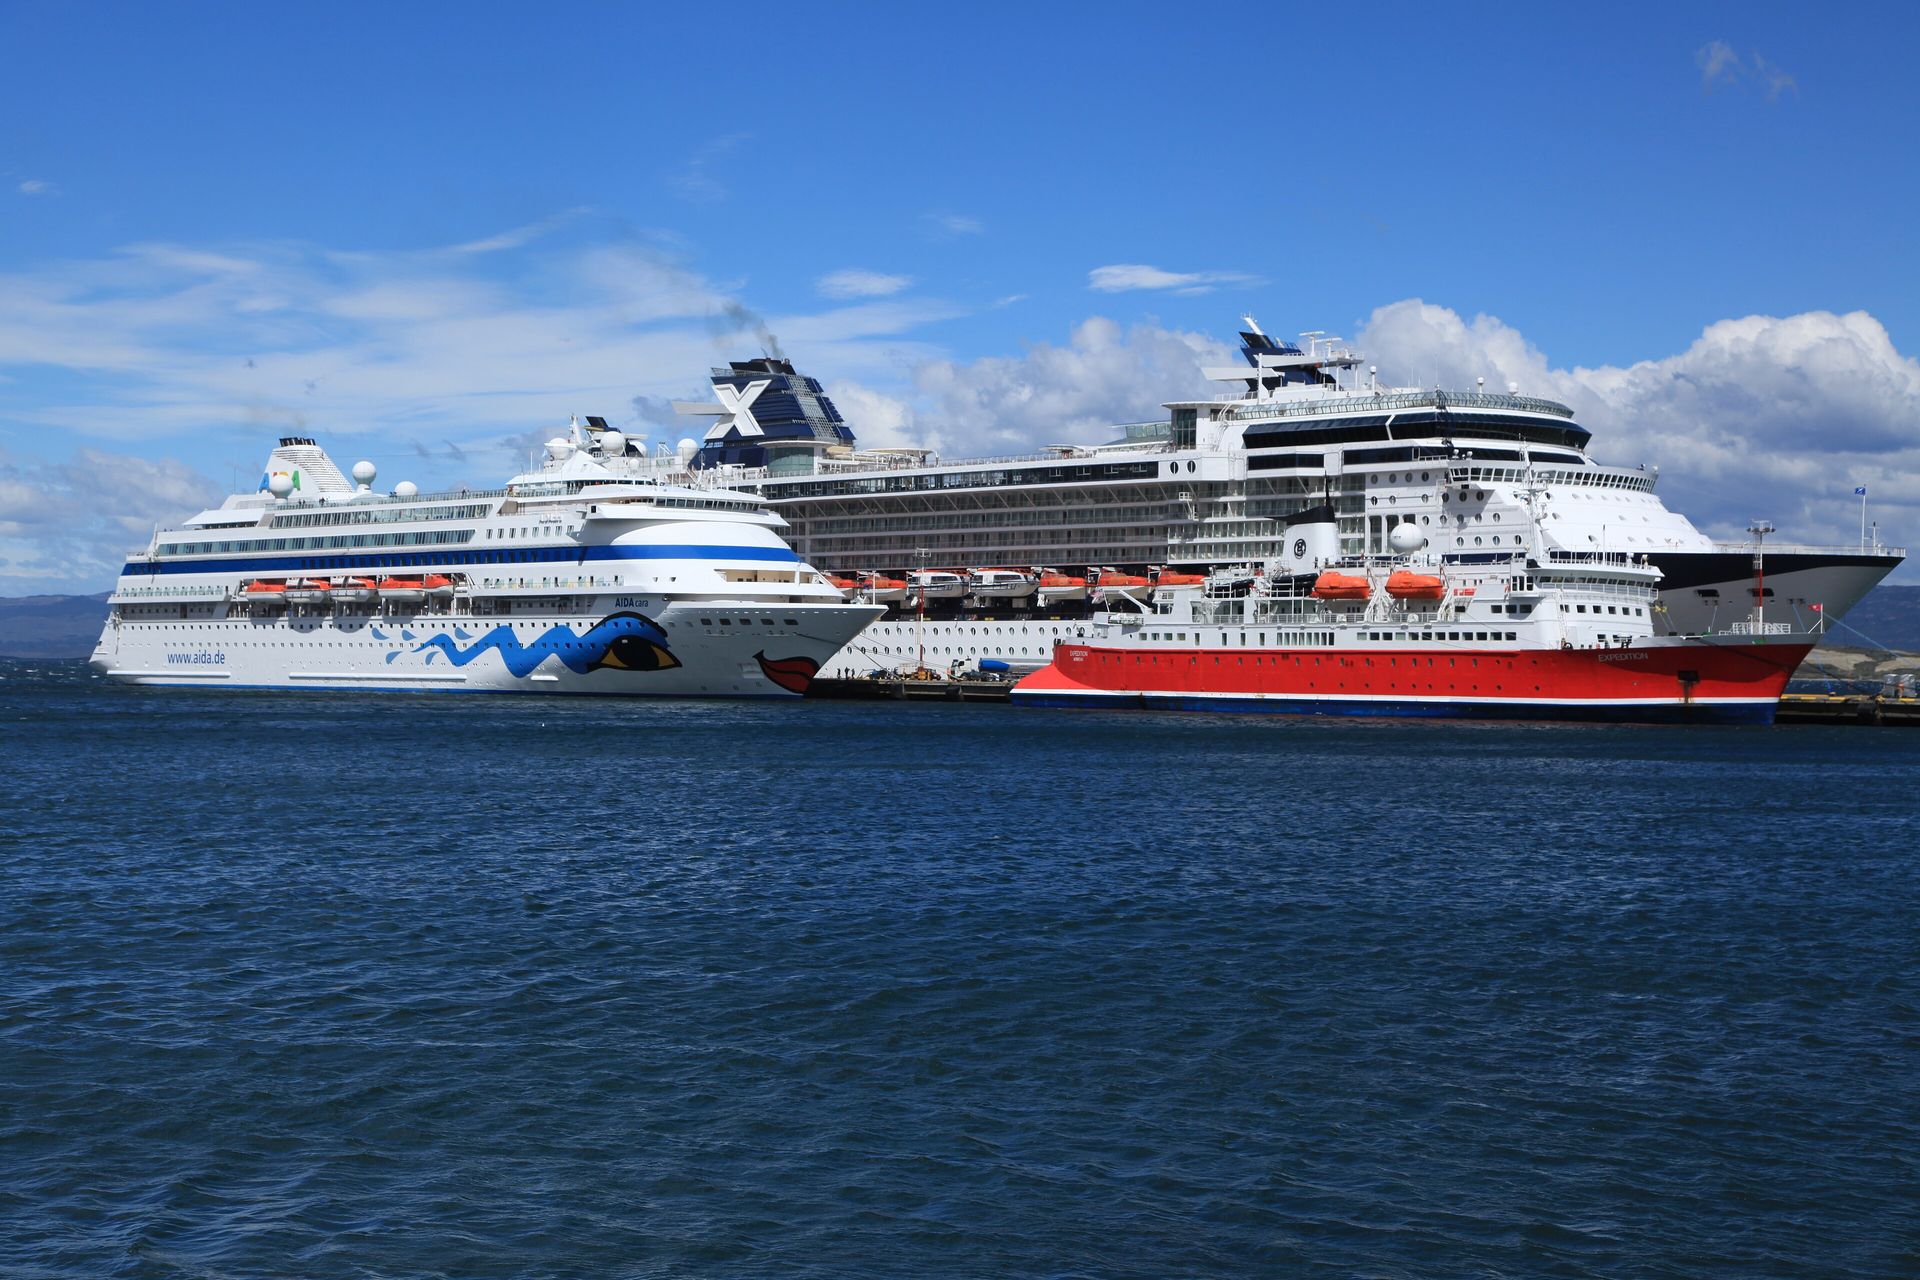
What is the cheapest way to get to Antarctica?
The lowest 2026-27 fares on eight expedition lines, what triple and quad cabins and shoulder dates save, what last-minute deals really exist, and what the cheapest trips leave out.
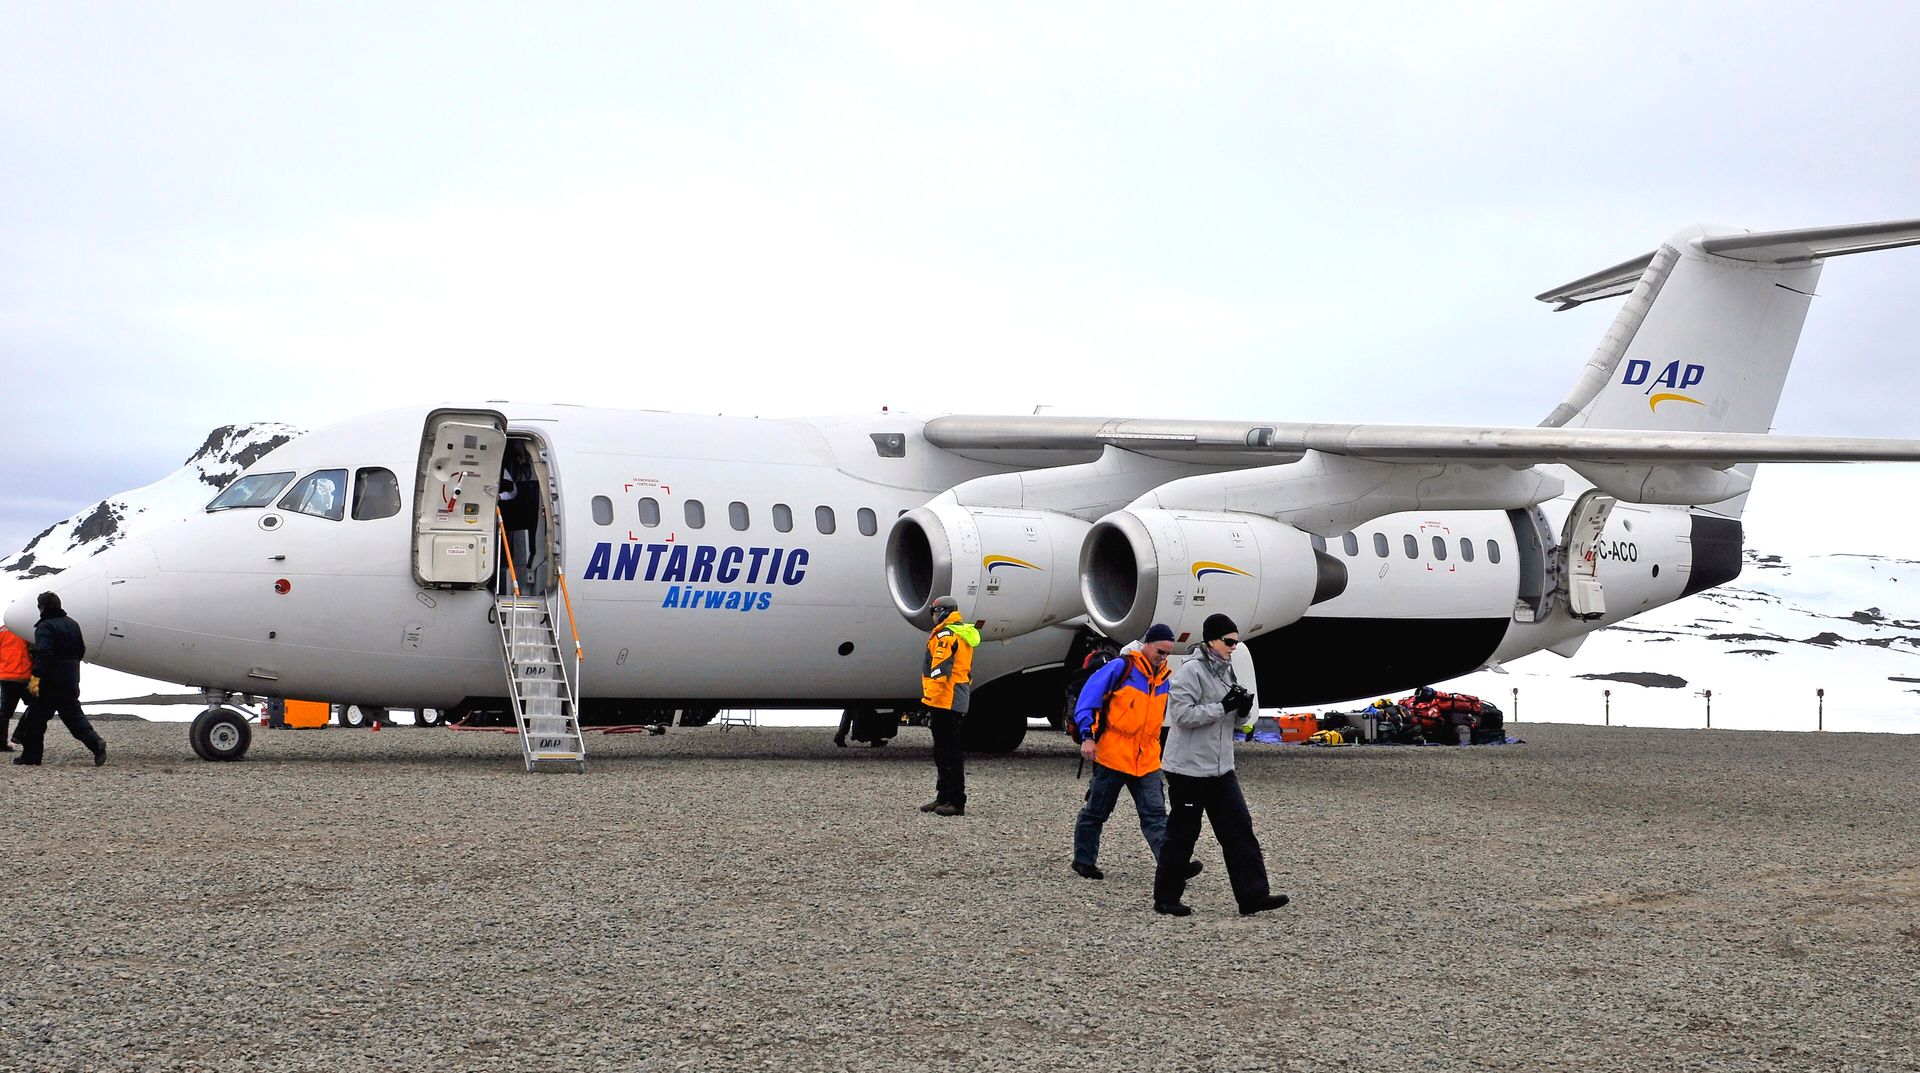
Should you fly or sail across the Drake Passage?
Flying over the Drake Passage saves about three days but costs more per day and hangs on the weather at King George Island. Fares, delay records, refund rules and who should pick which.
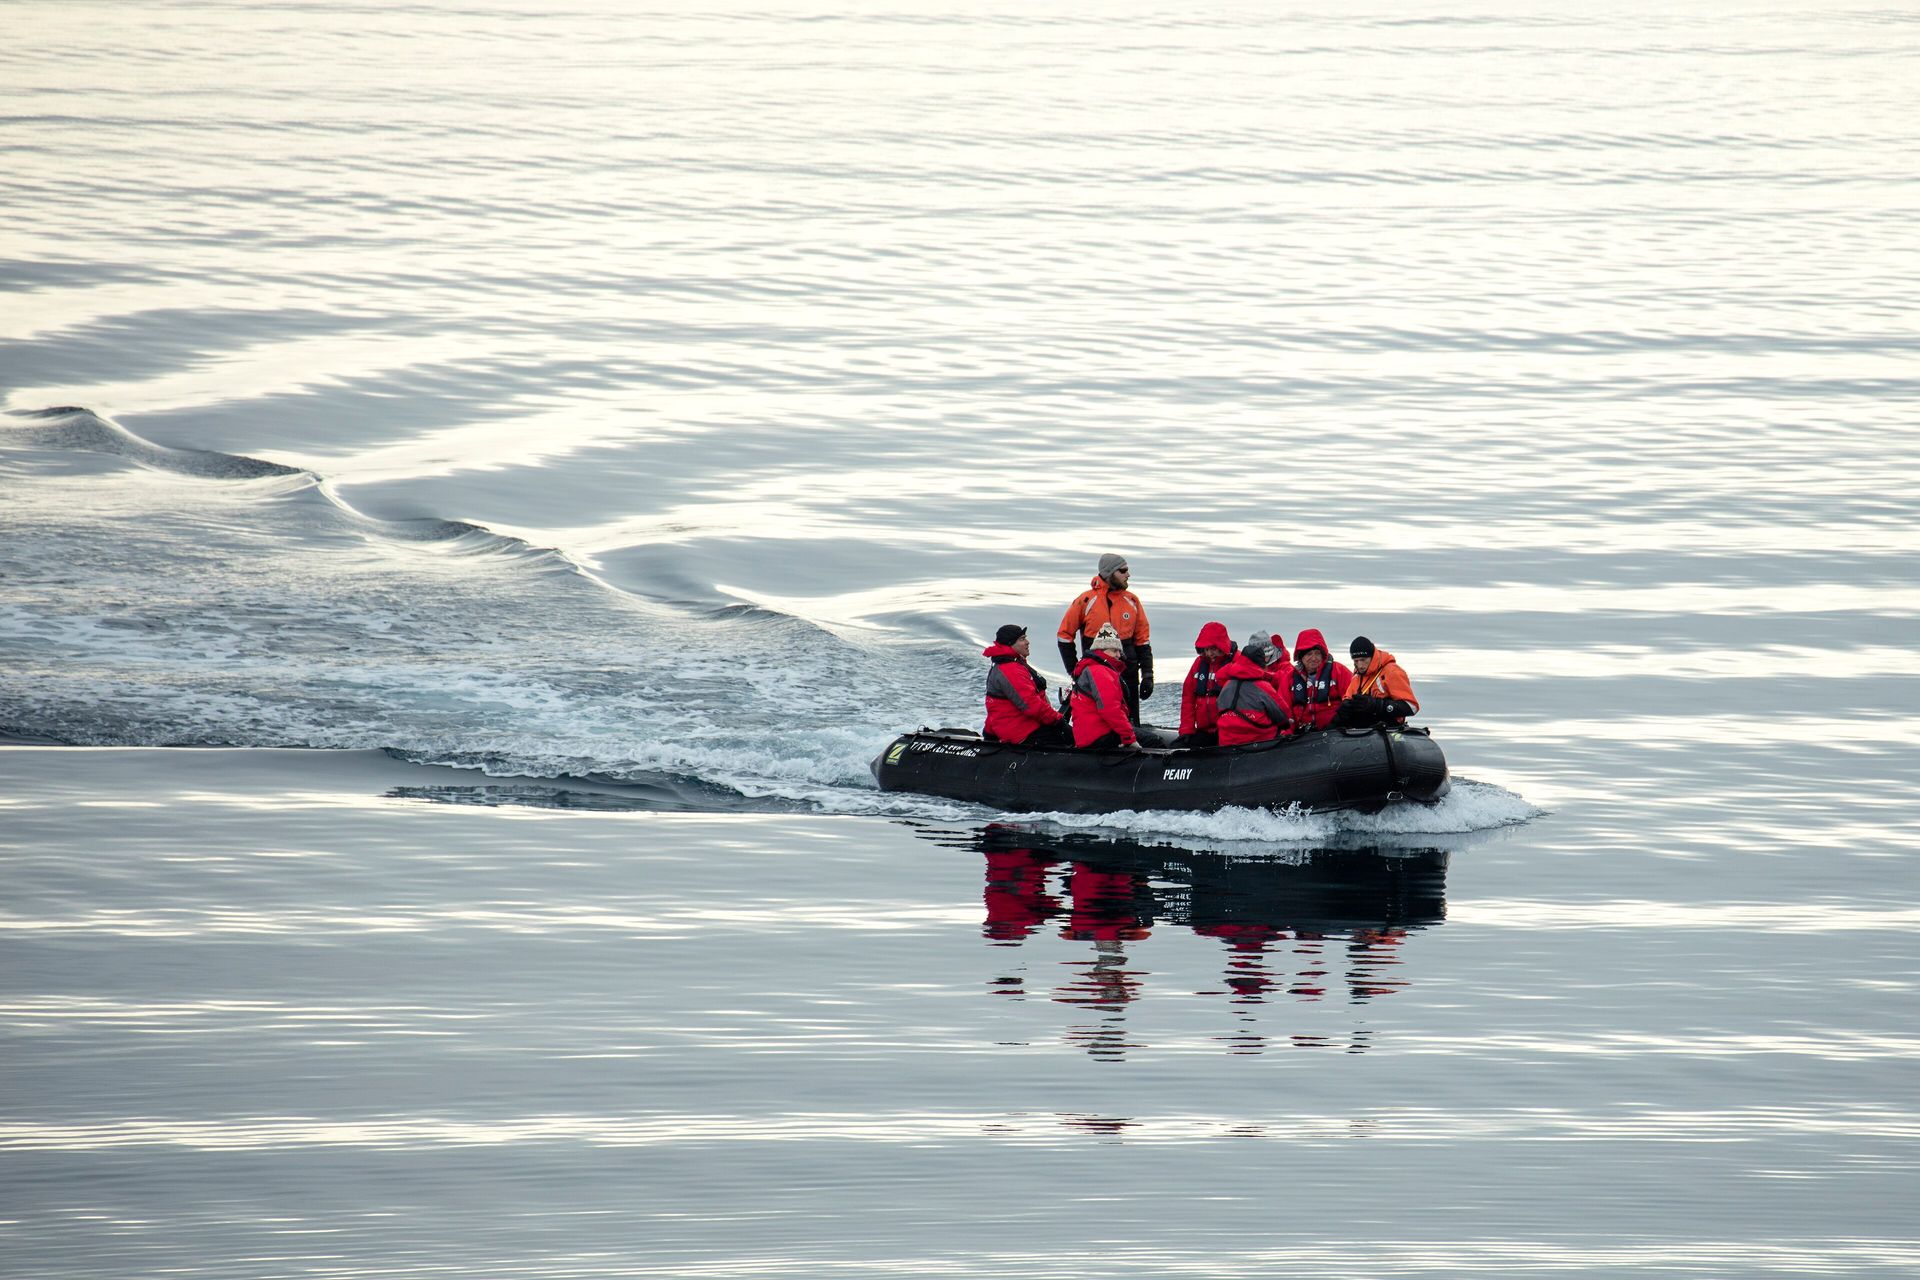
How to choose an Antarctica cruise
How to pick an Antarctica cruise: ship size and landings first, then route, the Drake crossing, activities, comfort and price, with eight expedition ships compared and a pick for each traveler.
When is the best time to visit Antarctica?
Antarctica month by month, October to March: temperatures, daylight, sea ice, penguin and whale timing, fares and crowds, with the best month for each kind of traveler.
Is a balcony worth it on an Antarctica cruise?
What a balcony costs on eight real Antarctic ships, which ships include one in every cabin, and the sea days, scenic passages and cruise-only trips where it pays off.
How much does an Antarctica trip cost?
Published 2026-27 fares from eight Antarctic expedition lines, cabin by cabin, plus the flights, hotel nights, insurance, tips and gear around them, with a worked budget for a couple.
Sources
- 1.READER monthly mean surface air temperature: Faraday/Vernadsky (WMO 89063), British Antarctic Survey (READER project). Accessed October 14, 2026.
- 2.READER monthly mean surface air temperature: Esperanza (WMO 88963), British Antarctic Survey (READER project). Accessed October 14, 2026.
- 3.READER monthly mean surface air temperature: Rothera (WMO 89062), British Antarctic Survey (READER project). Accessed October 14, 2026.
- 4.READER monthly mean surface air temperature: Bellingshausen (WMO 89050), British Antarctic Survey (READER project). Accessed October 14, 2026.
- 5.READER monthly mean surface air temperature: Amundsen-Scott South Pole Station (WMO 89009), British Antarctic Survey (READER project). Accessed October 15, 2026.
- 6.About the Continent, U.S. Antarctic Program, U.S. National Science Foundation. Accessed October 15, 2026.
- 7.READER monthly mean surface air temperature: Grytviken (King Edward Point), South Georgia (WMO 88903), British Antarctic Survey (READER project). Accessed October 15, 2026.
- 8.Global Surface Summary of the Day: Mount Pleasant (Falkland Islands), Esperanza and King Edward Point daily records, NOAA National Centers for Environmental Information. Accessed October 15, 2026.
- 9.READER monthly mean surface wind speed: Faraday/Vernadsky, Esperanza, Rothera, Bellingshausen, King Edward Point and South Pole, British Antarctic Survey (READER project). Accessed October 15, 2026.
- 10.Sun rise, set and twilight for Stanley, Grytviken, Port Lockroy, Rothera and the South Pole, October 2026 to September 2027, U.S. Naval Observatory, Astronomical Applications Department. Accessed October 15, 2026.
- 11.Sea Ice Index, Version 4: Southern Hemisphere monthly sea ice extent, National Snow and Ice Data Center (NSIDC). Accessed October 15, 2026.
- 12.Records of Weather and Climate Extremes Table (as of 31 July 2025), World Meteorological Organization. Accessed October 15, 2026.
- 13.Understanding Wind Chill, NOAA National Weather Service. Accessed October 15, 2026.
- 14.Drake Passage wave and wind climate 2010 to 2025 (RarestPlaces analysis of ECMWF ERA5 reanalysis), ECMWF ERA5 reanalysis via Open-Meteo; analysis by RarestPlaces. Accessed October 14, 2026.
- 15.Frequently asked questions, Government of South Georgia & the South Sandwich Islands. Accessed October 14, 2026.
- 16.READER monthly mean surface air temperature: Vostok (WMO 89606), British Antarctic Survey (READER project). Accessed October 15, 2026.
- 17.Antarctic weather, Australian Antarctic Division. Accessed October 15, 2026.
- 18.New study explains Antarctica's coldest temperatures, National Snow and Ice Data Center (NSIDC). Accessed October 15, 2026.
- 19.WMO verifies one temperature record for Antarctic continent and rejects another (1 July 2021), World Meteorological Organization. Accessed October 14, 2026.
- 20.Current South Pole Meteorology (latest conditions, October 15, 2026), NOAA Global Monitoring Laboratory. Accessed October 15, 2026.
- 21.Dates & Rates, White Desert. Accessed October 14, 2026.
- 22.Quick Facts About Sea Ice, National Snow and Ice Data Center (NSIDC). Accessed October 14, 2026.
- 23.Weddell Sea: In search of the Emperor Penguin, incl. helicopters, m/v Ortelius, 15 to 25 November 2026 (OTL22-26), Oceanwide Expeditions. Accessed October 14, 2026.